
The yield curve is a popular economic indicator. It is a graph of the yield on bonds with different maturity terms, and often used to gauge the direction the economy is headed.
Although you can create a yield curve from the yield and maturity of any type of bond, “THE yield curve” usually assumes we are specifically referencing the Treasury yield curve. The Treasury yield curve plots the yield on debt issued by the U.S. Treasury.
What is Yield and Maturity?
To set the stage and make sure we are all on the same page, a quick review:
- Yield is the rate of return earned on a debt instrument. For the issuer, it is the cost of borrowing money.
- Maturity is simply the length of the loan. Debt instruments are repaid when they mature.
Why Use Treasury Securities?
It is helpful to construct the yield curve with Treasury debt securities for a number of reasons.
- Treasury Yield does not Include any Risk Premium U.S. federal government debt is considered “risk-free” to the holder. The taxing authority of the federal government assures repayment - even if those dollars are worth less, you’ll still get your dollars back. Changes in the risk premium won’t distort a yield curve created from Treasury securities. That is good because that is not really what we are trying to measure or see with the yield curve. Corporate bonds, on the other hand, do include a risk premium.
- Treasury Securities have Many Maturity Terms The Unites States Treasury issues Bills, Notes, and Bonds for several different lengths ranging from one month to 30 years. As of late 2018, they even issue a 2 month debt. I didn’t include it int he curves below to keep the historical comparisons the same. This broad spectrum of maturities means you can construct a continuous curve.
- The Treasury Market is Very Active Since the Treasury market is very active the curve can be updated regularly. The Treasury posts estimated yields daily. Of course, this means that the yield curve will more accurately reflect current reality.
Normal Yield Curve
Normally, the yield curve slopes upward. Debt instruments with longer term maturities will usually have higher yields than short-term debt. There are several theories that help explain this.
Liquidity Premium Theory: Investors prefer to have access to their money. If they lend money for longer periods, they will have to be compensated for it. Therefore, longer term maturities will have higher yields.
Expectations Theory: Long-term yields represent investors estimates of future short-term rates over the maturity period. For example, the 10-year yield represents the average of next ten years of expected 1-year yields. Longer-term maturities will have higher yields when short-term yields are expected to increase.
Market Segmentation Theory: Investors, both individuals and institutions, purchase maturities to match their needs. Demand for the different maturities will then push yields up or down as those needs change. When the demand for short-term securities is higher than the demand for long-term securities, yields for short-term instruments will be lower.
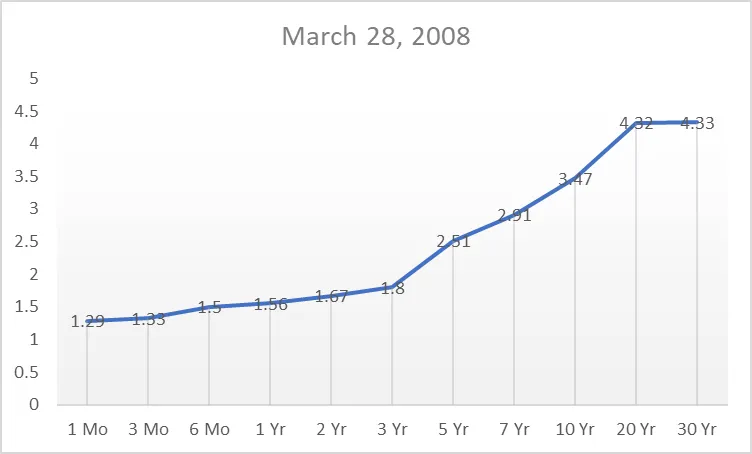
In this yield curve, I have plotted the yield on Treasury securities as of March 28, 2008. The numbers along the bottom of the plot represent the time to maturity. The numbers going up the left side are the various yields. As of March 28, 2008 a Treasury security with 1 month to maturity was yielding 1.29%. A treasury security with 30 years to maturity was yielding 4.33%
Flat Yield Curve
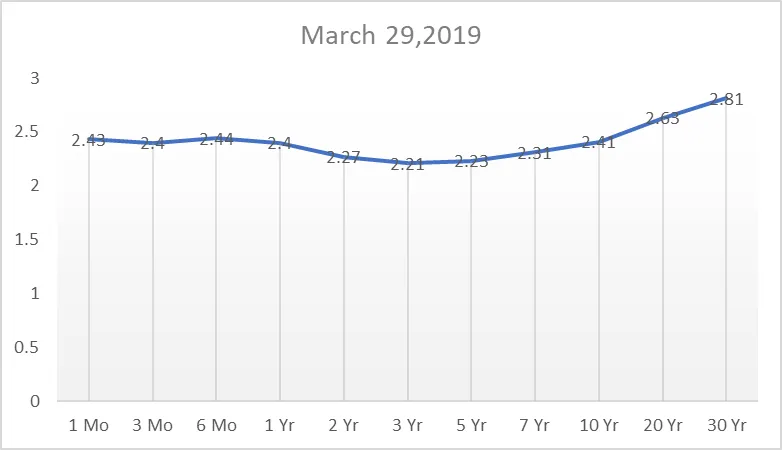
When the yield on long-term securities starts to fall or the short-term yield rises the curve starts to flatten. You can see that in the yield curve above.
As an investor looking to purchase debt securities for your portfolio, pay attention when the yield curve flattens.
Long-term debt instruments are riskier than short-term. As the market yield changes, the value of your bonds will fluctuate. Long-term bonds will fluctuate more than short-term notes. When the curve is flat, you aren’t compensated for this extra risk. It will make sense to shift to short-term maturities until long-term yields rise.
Inverted Yield Curve
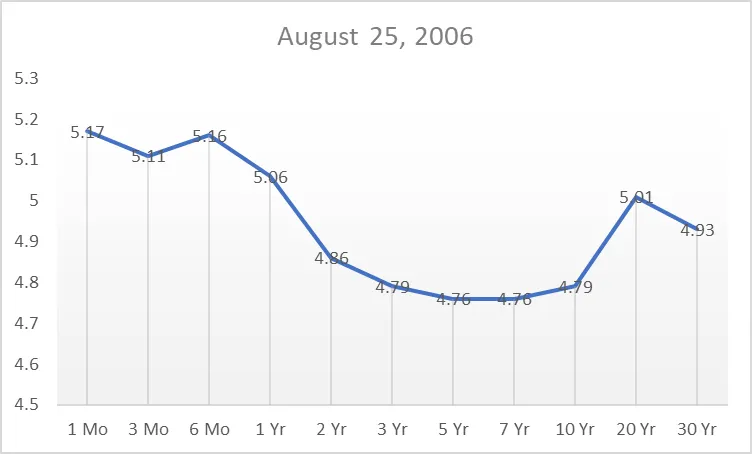
Then, there is the dreaded inverted yield curve. The yield curve inverts when the yield on short-term Treasuries is higher than the yield on long-term Treasuries. Notice that the curve now slopes downward.
On August 25, 2006 (a date that was randomly chosen to illustrate an inverted curve) the 30-year Treasury had a 4.93% yield while the 1-month Treasury had a 5.17% yield.
At this point, it makes the most sense to purchase short-term Treasuries.
Treasury Yield Spread
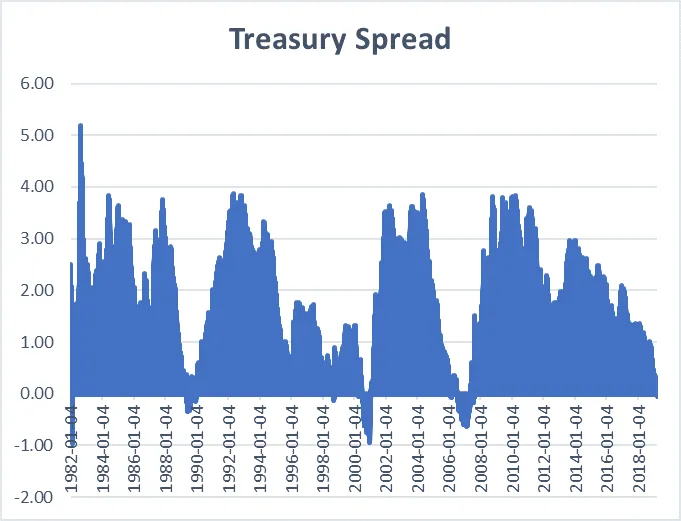
The slope of the curve is the difference between the yield on short-term and long-term debt. This is called the spread. In the chart above, I have plotted the difference between the 10-year and 3-month maturities since 1982. Specifically, it is the 10-year yield minus the 3-month yield.
The smaller the spread is, the flatter the curve is. The curve inverts when the spread is negative.
What Makes the Yield Curve Invert?
So what causes the yield curve to invert? More importantly, why does anyone care?
An inverted yield curve is one indication of a potential recession or bear market. We can illustrate this most simply by considering the expectations theory mentioned above.
Investors will bid up the price of long-term notes, and therefore put downward pressure on their yield, when they expect the near-term economy to perform poorly. The yield curve then gives you a way to read market sentiment through supply and demand.
This also happens when there is widely-held belief that inflation is going to be low. Since long-term yields contain an “inflation premium” the long-term yields fall as inflation expectations fall.
An expectation of low inflation is an implicit expectation of low economic performance.
Does the Yield Curve Predict Recessions?
Sort of. There is no question that the yield curve is an economic indicator. A normal yield curve indicates the economy is doing well and that people are optimistic that it will continue to do so. An inverted yield curve indicates that confidence in the economy isn’t as strong. Like all economic indicators though, it alone doesn’t tell the whole story.
Campbell Harvey first proposed that an inverted yield curve predicts recession in 1986. In fact, an inverted yield curve has proceeded each of the three recessions since then.
However, the yield curve has inverted without being followed by a recession as well. The yield curve inverted in both the late 80’s and 90’s without being followed by a recession.