The market risk premium is the return that you earn on stocks above what you could earn by investing in government bonds. For example, if the rate of return on the market is 15% when the rate on a government bond is 3%, the market risk premium is 12%.
A more formal way of defining the market risk premium is the market return in excess of the risk-free rate.
This measure is helpful for understanding why you want to have stocks in your portfolio. You can think of it as your compensation for taking risk.
Market Risk Premium Formula
The market risk premium formula is incredibly simple. You just subtract two numbers.
Market Risk Premium = Rm – Rf
Where:
Rm = Return on the Market
Rf = Risk-free rate of return
Market Return
To fully understand the market risk premium you need to know what we mean by the market. Correctly stated, “the market” refers to all possible investment assets. That even includes assets that don’t trade on a stock exchange, like land. To be clear, while that is the correct definition, it isn’t possible to identify all invest-able assets and then measure their returns.
For practical purposes you can think of it as the return on a broad market index like the S&P 500. That’s the normal treatment.
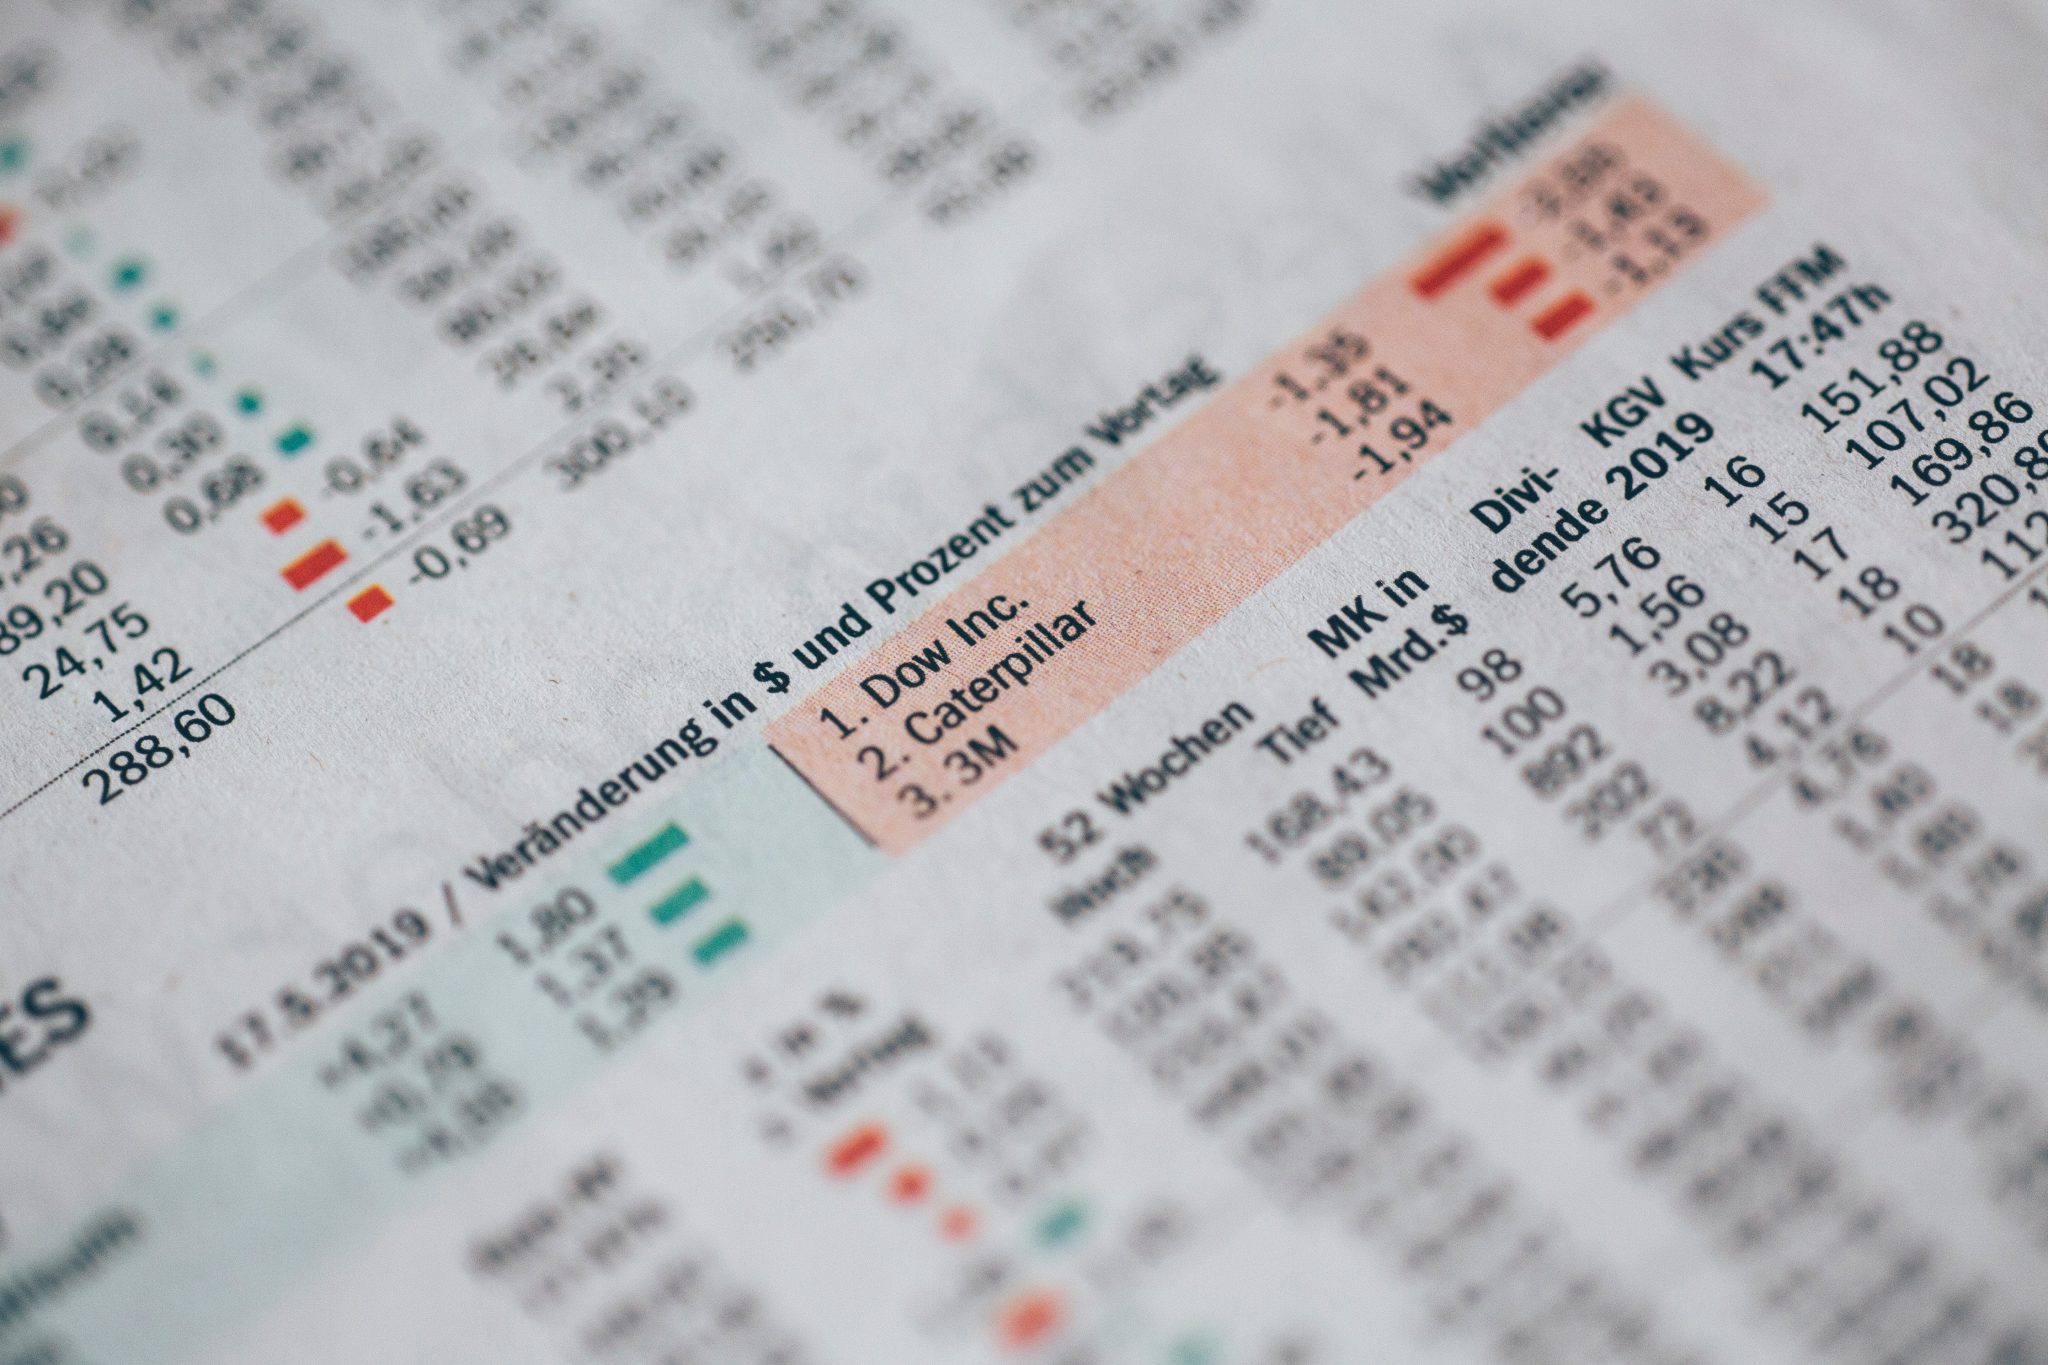
You can use other indices to represent the market too. The Dow Jones Industrial Index is another common example. An index that covers a larger piece of the total market would be more theoretically sound, even if still incomplete, but in practice the S&P 500 works just fine.
Vanguard has a Total Stock Market Index that represents the entire United States equity market. It goes back to 1992.
Risk-Free Rate
The risk-free rate is the rate of return you could earn for not taking any risk at all. If the market risk premium is supposed to represent your compensation for taking risk then we need a practical risk-free rate to compare to.
For that, we turn to United States Treasuries.
Why do we call United States Treasury securities risk-free? Surely there is at least some chance that you lose the money you invest in United States Government debt right? That’s right! US Treasuries aren’t completely risk-free in the truest sense of the phrase.
One simple reason we use the rate on US Treasuries is because it’s the closest thing we have to a literal risk-free rate. What makes them so safe? Taxes!
Because the Federal Government has such strong taxing authority there is very little chance it would default. If the Federal Government needed to, it could just raise taxes to pay it’s debt obligations. That really rolls off the tongue doesn’t it? Yes, there are a host of economic issues tangled up in that, but the relevant information here is that the bondholder would be paid back.
The other significant reason we call government bonds risk-free has to do with how we define risk. In academic financial models we often define risk as uncertainty. To the extent that an investments returns fluctuate, we say they are uncertain and risky. Because US Treasuries pay a stable and fixed rate of interest there is no variability, and therefore no risk.
Historical & Expected Risk Premiums
The market risk premium changes over time. I used data from the SBBI Yearbook to calculate a sample of values. From 1926-2015 the average risk premium was 6.6% when measured as the difference between large-cap stocks and intermediate-term government bonds. It was 5.7% from 1995-2015.
Some years it is quite large. In 1954 it was 50%. It can also be negative of course, since stocks can lose value. in 2008 it was -50%.
Of course, the past is the past. It’s the future market risk premium is what you’ll earn for investing in stocks.
The most common way of thinking about the market risk premium going forward is to simply use a historical average over a number of years. For example, the 5.7% I mention above. That’s a very simplified method, but it’s easy to do.
Using the Market Risk Premium for Asset Allocation
To use it in your asset allocation decision you would ask yourself if the expected market risk premium is worth the extra risk of investing in stocks. The more strongly that you feel the answer is yes, the higher percentage of stocks you would hold in your portfolio.
I want to be clear that I am not suggesting that you make short-term adjustments to your asset allocation based on a changing expectation of the market risk premium from year to year. Again, we can’t know what the market risk premium will be in the future.
What I mean here is that you can use it as a way of putting numbers to the risk and reward trade-off that is inherent to choosing how to invest. A simplified way to look at is to ask yourself, “If stocks have normally earned X% above the risk-free rate, how much exposure to I want to stocks given that they are riskier?”


