
Why are Investor's Returns Often Different than the Investments They Hold?
The research on investor performance is clear. The average mutual fund investor tends to have worse returns than the average mutual fund. Behavioral factors have a lot do with this. People tend to be emotional, and can often react in precisely the most incorrect way possible when markets are volatile. Fear often causes investors to sell investments when they are down. Performance chasing is another notable behavior.
Heard a lot about the latest mutual fund that is performing so well? That’s probably not the time to buy it, yet many are tempted.
However, it isn’t always investor behavior that drives a departure from their own returns and that of the investments they hold. Often, it’s simply a mathematical function of the way so many of us save for retirement. In fact, employing a systematic saving strategy can have the opposite affect of a bad timing decision and amplify the investors return.
Variable Nature of Returns
It is necessary to understand that returns vary. Of course, your retirement account statement usually shows the performance of each mutual fund within the account, and you can see the past performance as well. Consider the following example:
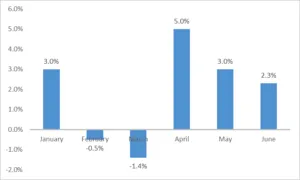
This chart shows returns of a hypothetical investment for a six-month period. $1 invested in this mutual fund at the beginning of January would be worth $1.019 at the end of June. This translates into a return for the period of 1.9%.
If you have this mutual fund in your retirement account, and let’s say for purposes of keeping the example simple that you aren’t properly diversified and it’s the only fund you have, you will likely have a very different return for your account for the same period.
Periodic Purchases
Because so much of retirement saving is done through employer sponsored plans such as 401(k)’s and 403(b)’s, investment purchases typically follow the compensation pattern of the employee. Following with our example, let’s assume that you are paid once monthly. If you have a salary of $75,000, and contribute 10% of your salary to your retirement account, then you would contribute $625 per month to your account. Again, for simplicity, lets ignore employer matching contributions… although you should definitely not ignore them in practice!
Investor’s Return
Now, let’s walk through how this is applied. Investing your first contribution in January (the simplifying assumption here is that you have received January’s salary on Day 1, and invested your savings on the same day) gives you an account balance of $625 x 1.03 = $643.75 on the last day of the month.
For February, you have the $643.75 from January, plus February’s $625 contribution for a total of $1268.75. In February, your mutual fund loses ½ of a percent. This leaves you with $1268.75 x .9905 = $1256.70.
Following for the next four months your account balance would be:
- March: $1855.36
- April: $2604.37
- May: $3326.26
- June: $4042.13
The rate of return for your retirement account is 2.99% for the period. This is known as the time-weighted rate of return because it accounts for the time differences for each of the monthly contributions.
Systematic Planning Beats Emotion-Driven Decisions
The takeaway here is that a systematic approach to investing can help reduce judgement errors by taking advantage of a concept known as dollar-cost averaging.
Because the same amount is invested each month, you naturally buy more shares when the prices of the mutual funds you hold in your retirement account are low.
In fact, a bear market can benefit you if you are still in the accumulation phase of your retirement plan.